


Welcome to M3 for November 7th.
An eventful week tin the Market with the FOMC Making their expected 75 Basis point hike of the Federal Funds Rate to the 3.75-4% range. The Market gave back the prior week’s gains leading up to the meeting but has traded relatively flat since the announcement.
A quickly positioning check and we find that on Wednesday of last week Investors quickly jumped for cover. The market was positioned for downside on the day of the meeting to an extent not seen since March of 2020.

CEO Confidence is at new all time lows. Past troughs in CEO Confidence have all coincided with major market bottoms.

Key leading indicators of inflation have seen clear rollovers.

Particularly Used Vehicle price inflation, which was red hot coming out o the Pandemic.

As inflation has transitioned to more of the “Stickiest” components, on of which being Housing. It is also showing signs of slowing down.

The growth in rental prices has materially slowed and Owner’s Equivalent Rent may be soon to follow.

The Fed’s Monetary tightening efforts are working incredibly well, almost too well. It is working so well that after a roaring increase in 2021 from stimulus checks and excess savings, US Commercial Bank Deposits have fallen for the first time since 1994 during the Mexican Peso Crisis (you can hardly see it on the chart).

And on that note, for those Austrian Economists out there – Money supply growth has collapsed. It has historically been excellent leading indicator of inflation.

Here is a longer term look at the relationship between the change in the Money Supply and the change in inflation. Since 2016 with introduction of large-scale Quantitative easing, inflation has become a lagging function of the change in the Money Supply – the change in Central Bank Balance sheets.

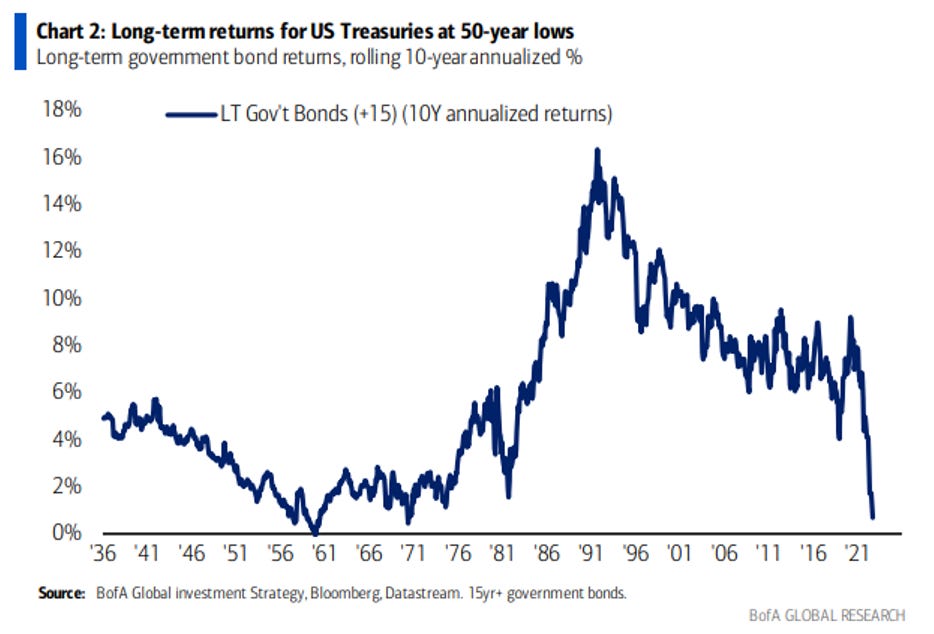
As central Banks unwind their Balance sheets through Quantitative tightening efforts and Rate hikes, the 10 Year Treasury Bond is having its worst year since 1788.

Annualized returns for long term Government Bonds are historically poor, even over longer time frames. An investor in Long term Bonds has made almost nothing having been invested over the last 10 years
Although it may seem so, the expected return on Bonds is not much of a mystery. There is a very strong positive correlation between the starting Yield to worst on the US Aggregate Bond Index and the subsequent 5-year annualized returns. The relationship is almost 1 to 1 in the sense that historically, whatever the starting yield was, that yield was approximately your 5 Year annualized expected return.


The key event this week will be the US CPI Numbers on Thursday – the market is expecting data lower than last Month with consensus at 8% YoY.